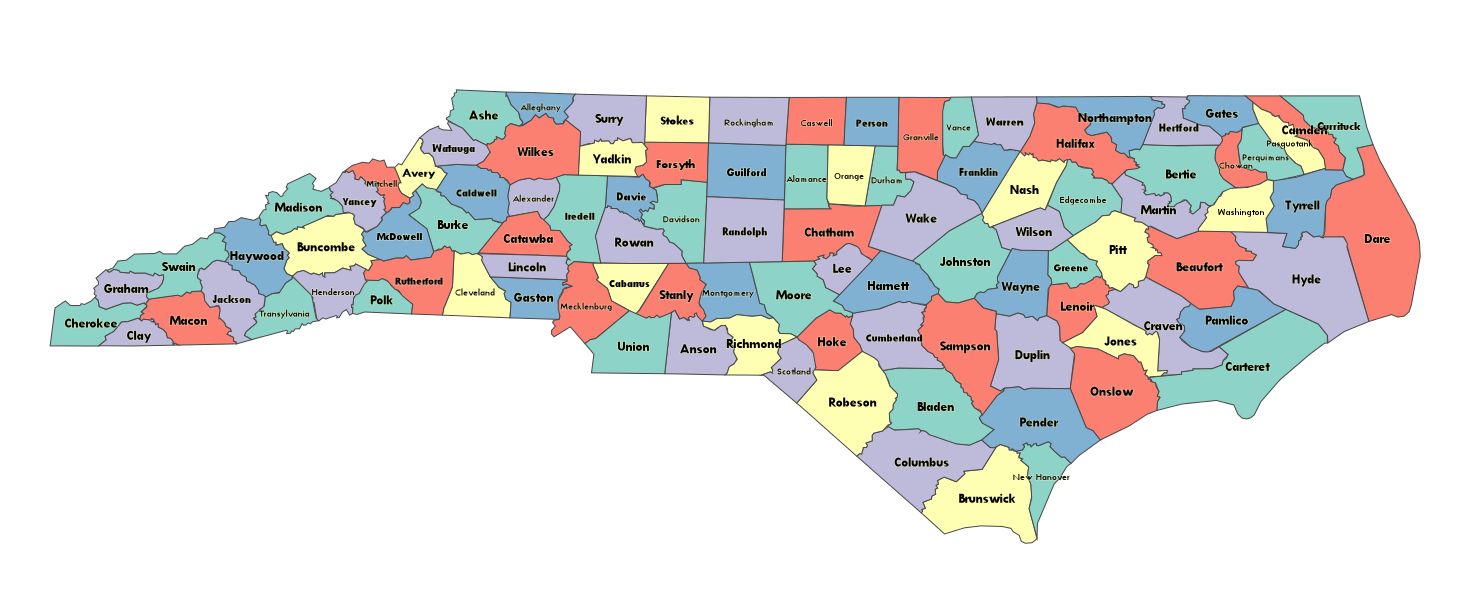
Okay, so why would you prefer to do it the Geoanalytics way over using SLD? Because you can do this using just the stylesheet:
That is to say you can do the five-coloring and the county-width based font sizing in the styler alone. Now, truth be told you should compute the five-coloring ahead because it requires a rather large number of comparisons. What I’m going to detail in this tutorial is not the best nor most efficient way to do things, but rather a demo of the kinds of things you can do, whether or not you really should. First off, let’s look at the WMS query that brings this back. I have the entire county listing for the United States in the database here, and I’m only showing the counties of North Carolina. I do that with a filter parameter. There are others that will work, but this is based off the TigerLINE 2010 data and I knew that it would work:
http://localhost:8000/iei_commons/wms/?service=WMS&request=GetMap&version=1.0.0
    &bbox=-85,30,-75,38
    &format=png&layers=the_geom
    &width=1536&height=1280
    &srs=EPSG:4326
    &styles=fancy
    &filter={"geoid10__startswith":"37"}
I’ve broken things up across multiple lines so they’re easier to see, but take note of the filter, because it’s not CQL. Filtering in Geoanalytics follows the same rules as filtering in Django or Tastypie. (Nearly) any legal filter in Django will work on the URL line in Geoanalytics. Filters are expressed as JSON documents and can contain any number of clauses. 37 is the FIPS state code for NC, so I simply wrote a filter of “geoid10__startswith” : 37. Filters are applied after the geographic filter in Geoanalytics, so they tend not to be too expensive. If you’re using an indexed field, they’re even cheaper.
So in rendering this, I did not modify the table beyond the default shapefile import of the US county census data as downloaded from census.gov. The five coloring is done on the fly. The font sizing is done on the fly. How? Here is my styling code. This is put in views.py:
import csp
import json
import os

palette = [(a/255.0,b/255.0,c/255.0,1.0) for a,b,c in [
    (141,211,199),
    (255,255,179),
    (190,186,218),
    (251,128,114),
    (128,177,211)]
]
colors = {}

def calculate_colors():
    global colors, palette
    if os.path.exists("colors.json"):
        colors = json.loads(file("colors.json").read())
    else:
        adj = dict([(county.geoid10, [s.geoid10 for s in CensusCounty.objects.filter(the_geom__touches=county.the_geom)]) for county in CensusCounty.objects.all().only('the_geom')])
        problem = csp.MapColoringCSP([0,1,2,3,4], adj)
        solution = csp.min_conflicts(problem)
        for s, c in solution.items():
            colors[s] = palette[c]
        with open('colors.json', 'w') as f:
            f.write(json.dumps(colors))

def five_color(data, _):
    global colors
    if not colors:
        calculate_colors()
    return tuple(colors[data['geoid10']])

def county_label(data, _):
    return data['name10']

def stroke_width(_, pxlsz):
    k = 1./pxlsz
    if k > 1:
        return 1
    elif k < 0.3:
        return 0.3
    else:
        return k

def font_size(data, pxlsz):
    minx, miny, maxx, maxy = data['the_geom'].extent
    width = (maxx-minx) / pxlsz
    length = len(data['name10']) * 10.
    return max(10, min(14, (width/length) * 12))

fancy_county_styler = styler.Stylesheet(
    label = county_label,
    label_color = (0./255.,0./255,0./255,1.),
    font_face = 'Tw Cen MT',
    font_weight = 'bold',
    font_size = font_size,
    label_halo_size = 1.5,
    label_halo_color = (1.,1.,0.7,0.4),
    label_align = 'center',
    label_offsets = (0, 5),
    stroke_color = (72./255, 72./255, 72./255, 1.0),
    stroke_width = stroke_width,
    fill_color = five_color
)

class CensusCountyWMSView(WMS):
    title = '2010 TigerLINE Census Counties'
    adapter = GeoDjangoWMSAdapter(CensusCounty, simplify=True, styles = {
        'default' : default_county_styler,
        'fancy' : fancy_county_styler
    })

class CensusCountyDeferredWMSView(CensusCountyWMSView):
    task = census_county_renderer
Now this could have been done better, to be sure. For one thing, the first time someone uses this the computation of the five-coloring takes forever. There are better queries that could have been used to determine the adjacency matrix, and it could be calculated once at the time that the data is loaded and stored in a file or in a separate table. But this is an illustration of the power of fully programmable styling as opposed to the kind of styling you can specify in an XML document.
So let’s break this down a bit. The palette variable is just a dictionary we use to populate the color table for each of the counties. It contains four-tuples of colors (taken from colorbrewer2.org). We define a calculate_colors function that sets up a consrtaint-satisfaction problem for five-coloring a map. This is called once for our map, and should properly save the file to some sane, safe location and not “colors.json”, but no worries for now.
Then we have four functions that style particular properties of the data. They are:
- five_color, which looks up the color in our cached map of colors and calculates colors if no map exists.
- county_label, which simply returns the name field from the data.
- stroke_width, which scales the stroke width slightly so that extremely zoomed out views don’t have the outlines overcrowd the view and extremely zoomed in views are too boldfaced.
- font_size, which checks the extent of the geometry that the label will be rendered onto and then scales the font so that it (mostly) fits inside each county.
Finally, we create a stylesheet, fancy_county_styler that uses all our functions to dynamically style the data.
Now, you may argue, “But Jeff, I can simply append color and font size to the data and use an SLD stylesheet to achieve the same thing,” and you’d be right, but this and other issues like it are at the root of how so many copies of data end up existing when one copy of that data would do (locally cached, but unmodified, of course). It’s a simplification, and honestly styling data should not be part of the underlying data model. It blurs the MVC boundary and that ends up leading to siloed applications that can’t talk to each other because everyone has different requirements for their views.

