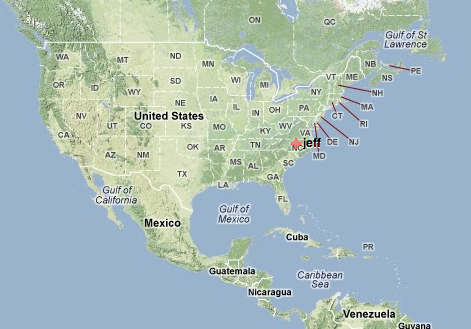
So you can make a map, but what do you do with it when you have it? The Big Board attempts to answer that question with a collaborative environment that lets you layer your data with others’ data, and provides “teleconferencing” like facilities over that. These teleconferencing facilities include annotating the map, a discussions tab for instant messaging of participants, customizable controls, and a customizable catalog of overlays containing your data and other people’s data to layer onto a base map. All this is done in a web-based platform that operates on any modern browser, including tablets like the iPad and Android-based Motorola XOOM without plug-ins, special exemptions by the IT department, or other setup. The Big Board is written entirely using HTML5 and Javascript on the front end and uses RENCI’s Geoanalytics platform as its backend.
The Big Board is mobile-enabled from the ground up, giving you the ability to see the same interface, scaled and adjusted for touch-interaction, on your tablet as well as a desktop.
To begin with, a user creates a conference room, gives it a name, and assigns it a base-map layer (by default, Google), and then clicks a button to create the room and join the conference. Then one is presented with the base map and a number of tabs along the bottom of the screen explained in more detail below.
The base map
The base map is simple enough. You will be asked to share your location by the browser, and you should click “yes” to put yourself on the map (if you click no, you will be shown in that unique location just west of Gabon and south of the Ivory Coast known where the prime meridian and the equator intersect: lat/lon 0.0, 0.0.) Drag your mouse (or your finger!) to pan, and pinch or use the buttons to zoom in and out. The map should scroll and zoom smoothly and you should see yourself as a cross above your current location.
The Overlays tab
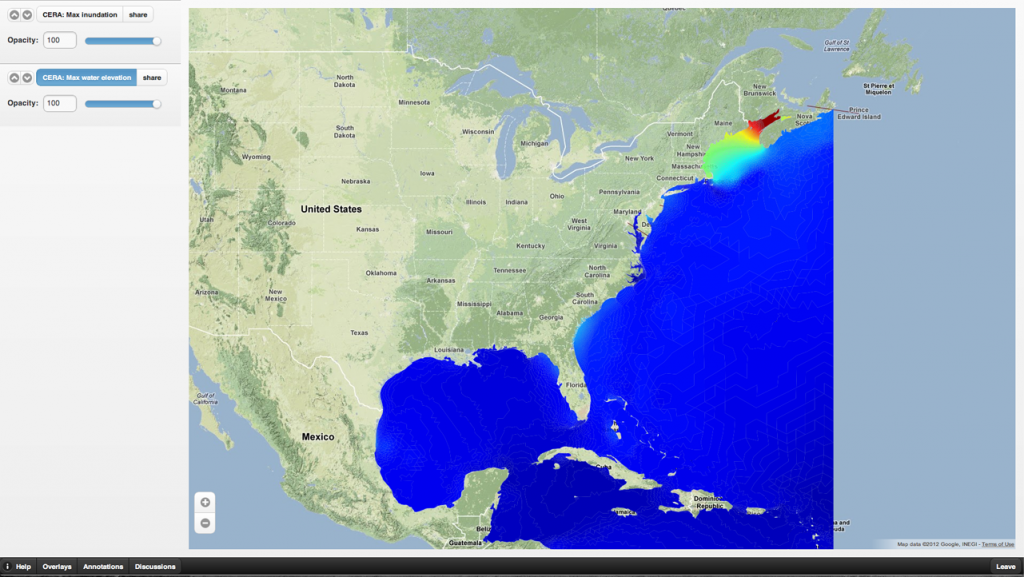
The Big Board opens to the Overlays tab. This is how you get large quantities of data onto the map. An overlay can be taken from any number of standard services on the web, or can be provided by the Geoanalytics framework using your own data. Clicking on the button with the overlay name will display it on your map. Clicking on the “share” button next to that will put it on the map of all the participants, showing them the same view you have. Dragging on the slider below the overlay name will change the transparency of that overlay. Clicking on the up or down buttons to the left of the overlay will raise or lower the overlay above or below others that are turned on.
The Annotations tab
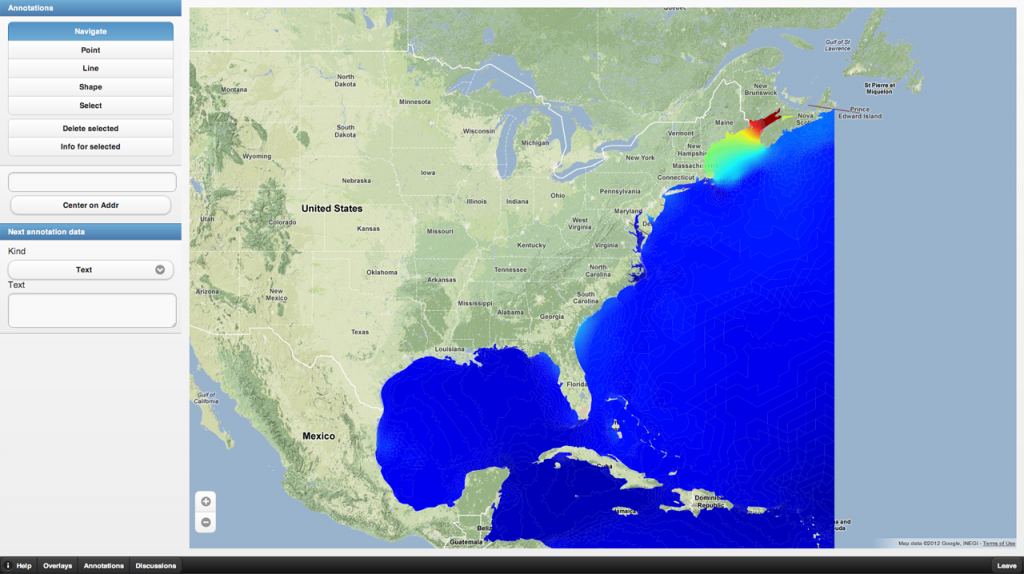
Moving to the right of the Overlays tab is an Annotations button. Click that and you will find yourself presented with these controls:
The annotations controls, and any custom controls provided by the administrator to your conference room are contained on this tab and provide ways to query and mark up the map. To add an annotation, first type any text or upload any files you want to add under the heading “Next annotation data”. Then click on one of the controls: Point, Path, Shape. From there, you can click on any point on the map and the next annotation will contain the text / image / video / audio / PDF file or what have you that you uploaded. Special note: if you want “freehand” drawing of paths and shapes, hold down the shift key while you draw. To get at these annotation data, move down to “Select” and click that, then click on any annotation on the map until it’s highlighted blue, and then click “Info for selected” to get an overview of the data associated with the annotation. The “Center on address” feature will let you type in an address and
The Discussions tab
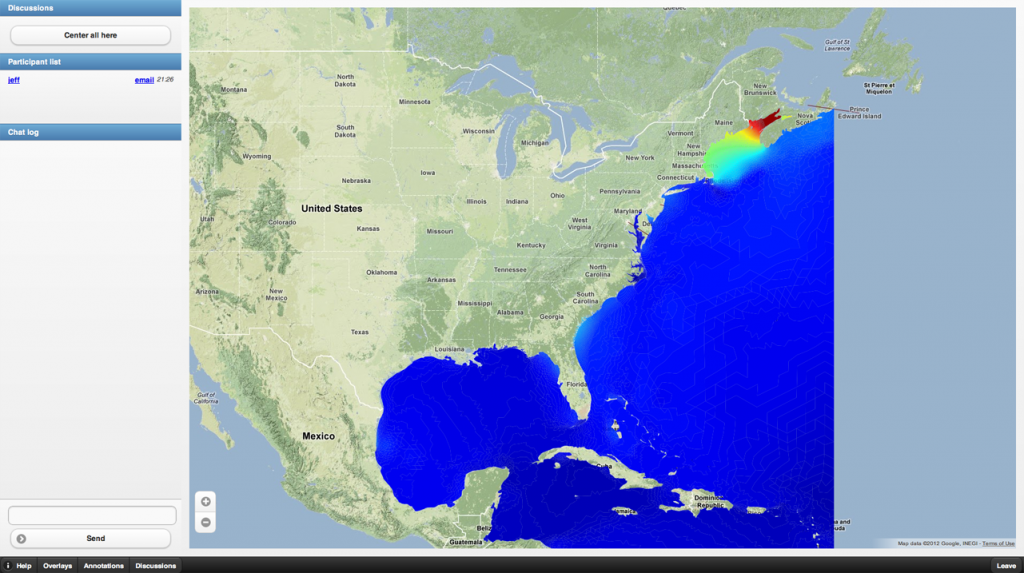
Finally, the discussions tab gives you the ability to locate your other participants and chat with them. Click on any participant’s name to center on that participant on the map – helpful especially for highly mobile participants. Clicking on the “center all here” button will re-center the conference room to this position for everyone, including new users, and let you call out or point to something on the map exactly as you see it. The chat window allows you to type messages to your fellow participants.
Wrapping up
The Big Board is part of RENCI’s Geoanalytics platform, and is available Open Source under the RENCI (MIT-style) license. You can reach the source code, as well as the source code for other Geoanalytics projects on GitHub. Please feel free to add ideas and comments at the bottom of this post!


